Bode Plot app allows to measure and visualize the frequency response of an audio system. The subjects under the test might vary from an isolated unit like amplifier or guitar pickup to the multicomponent systems comprising an amplifier, acoustic system and the room itself.
The app consists of a generator producing tone swiping in the audio frequency band, and an input signal meter.
To run the measurements you need an audio interface with its input and output connected to the subject under the test. Type of the connection and extra components required depend on the measured subject.
Making connections
Building a frequency response graph for an amplifier is the simplest setup. All you need to do is to connect audio interface output to the amplifier input and amplifier output to the input of the audio interface.
Building a Bode plot for a guitar pickup involves an extra component - the coil driver, which is connected to the audio interface output. The guitar pickup is to be connected to the audio interface input. The Bode Plot app provides extra settings to compensate the driver inductance, which ensures constant current within full frequency range. It also allows to keep constant flux by reducing the current running through the coil driver at the rate of 6db per octave.
Measuring room frequency response usually involves a measurement microphone connected to the audio interface input and an amplifier with acoustic system connected to the interface output.
IMPORTANT: If your audio interface supports direct signal monitoring, that is sending input signal directly to the output, make sure it is deactivated, otherwise you will get positive feedback immediately. Keep in mind that if using a Bode Plot plugin, the direct monitoring signal chain might be activated by your DAW.
Configuring Audio
The first step is to ensure the Bode Plot app is set to use your audio interface. Please use File/Audio menu to activate the audio settings widget. Note that when using Bode Plot plugin the File/Audio command is not available, as in this case you DAW controls the audio settings. Keep in mind that the app works with mono signal, so pay attention to the channels selected.
If you use AxeTech coil driver, it is wired to the left channel (usually Output 1 in a stereo pair).
There is no need to configure the lowest latency (the smallest buffer size). Bode Plot will automatically measure the true round trip latency and will adjust to it. Setting the latency much higher that your hardware allows would help to avoid errors caused by momentary drop-offs caused by buffer underrun.
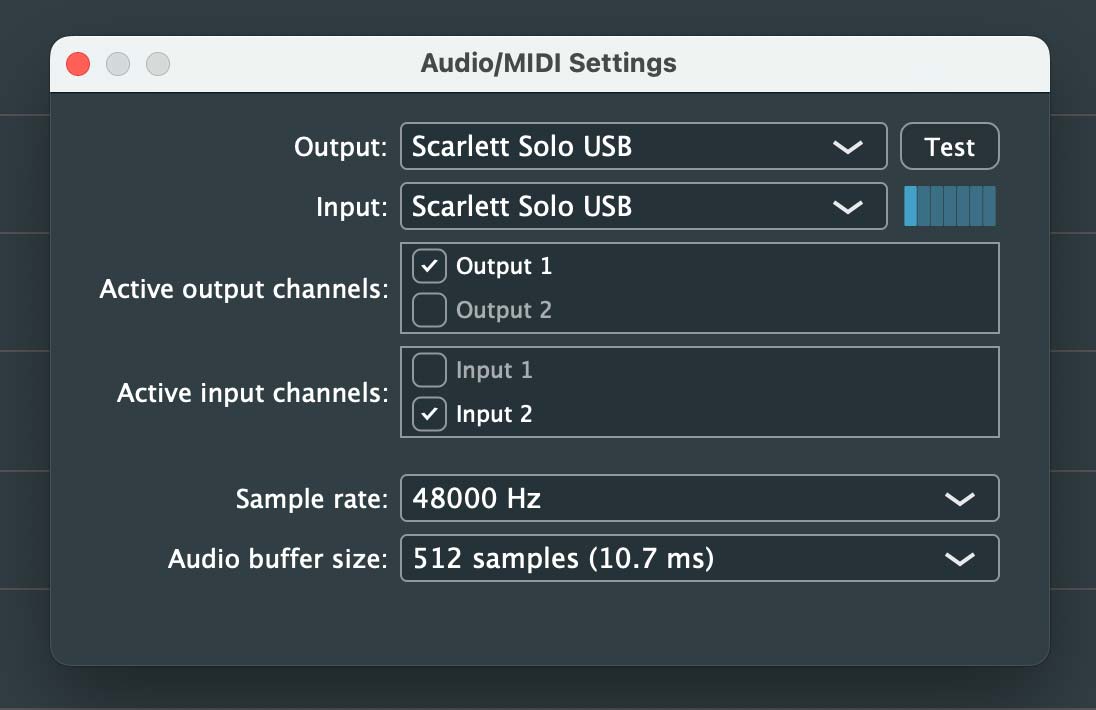
HINT: It is very helpful to audition the generator signal either via external monitors connected to your audio interface, or using headphones connected via Y cable. If using any of the above methods, just tap the Test button in the audio setup panel and make sure you can hear the short beep.
Setting signal level
Bode Plot requires starting signal level -40db or louder. You can gauge input signal strength using the input signal meter found in the lower left corner of the app interface. The lowest value the meter shows is -60db, so the green bar should occupy at least 1/3th of the meter height to be at the required level.
To set the level:
- Set both gain and volume rotary sliders to the lowest values (-20db for gain and 0 for volume).
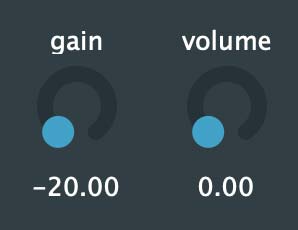
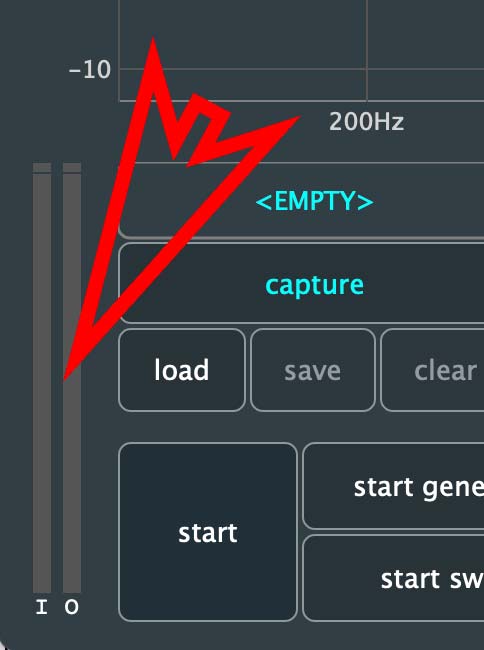
- Click the "start generator" button (note: it is not the big "start" button, it is a button to the right of the "start"). Generator will start to emit a tone with the frequency set by the "min fq" rotary slider. You can monitor output signal through the meter located in the lower left corner, next to the input level meter. By rotating the volume slider set the output level to approximately -10db to -6db - the green bar should take about 5/6th of the meter height.
CAVEAT: The output meter shows the level of the signal being sent to the audio interface. Your goal is to ensure the highest signal-to-noise ratio, that's why we suggest setting it to -10db. But your audio interface most likely has its own output level controls. Make sure you audited the resulting output signal to ensure the volume is not too low and there is no distortion caused by overload.
- Now that output level is set properly, start increasing input signal gain. To ensure high signal-to-noise ratio for the input signal it makes sense to start with gain control found on your audio interface rather than using Bode Plot gain control. Please refer to the input signal meter provided by your audio interface, make sure you can reach -20db to -10db level as per your auto interface meter. Account for potential increase of signal level due to non-linear frequency response of the device under the test - you might need to leave reasonable headroom for the signal to avoid distortion and clipping.
If after adjusting input gain on the audio interface you still see the "input signal too low" message, start increasing gain using Bode Plot controls.
- After reaching the required input level you will hear a series of short beeps emitted by the Bode Plot generator while it measures round trip latency. After that you may want to increase the gain value just a little to compensate for your UI input device imperfections - this is highly recommended if using touchpad or moving mouse to adjust the gain. Adjusting UI sliders by rotating mouse wheel usually does not result in values slightly bouncing back after lifting your fingers.
Running measurements
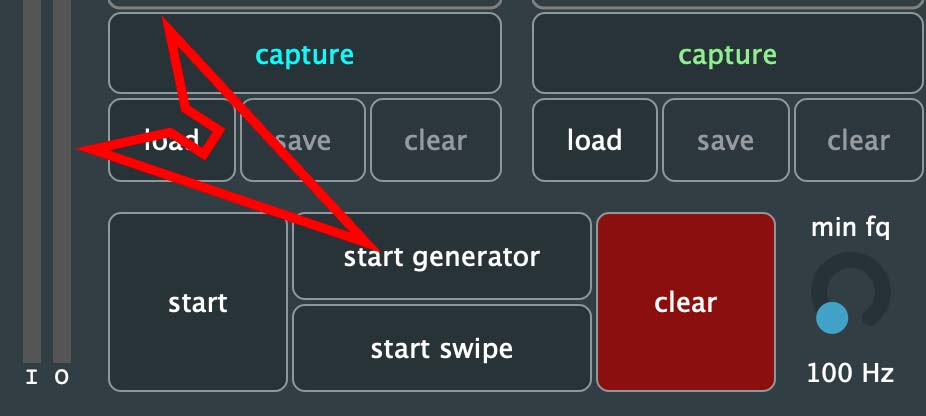
After signal levels are set click the big "stop" button, then red "clear" button. The Bode Plot is ready to make measurements. Click the big "start" button to begin profiling. During the measurement run you may pause swiping and generator independently of each other - you might want to do this to adjust the audio levels in an event of signal clipping. If you adjusted the signal levels, please reset the profiling by clicking the red "clear" button.
You can capture the current plot (always the red line) into any of the four plot slots for saving, annotating and comparison.
Using File/Export menu you can export complete project (current plot and content of all 4 plot slots) into CSV file for further analysis.